Monarch Populaton Data Overview
Thousands of citizen scientists have been collecting monarch data for decades, as part of several different programs. Unfortunately, many of these data sets remain inaccessible to the public, scientists, and even the volunteers who have been laboring tirelessly to collect the data. Here, we offer an interactive tool to examine yearly trends from a number of monitoring programs, both continental and regional in scale, during different phases of the monarch’s migratory cycle.
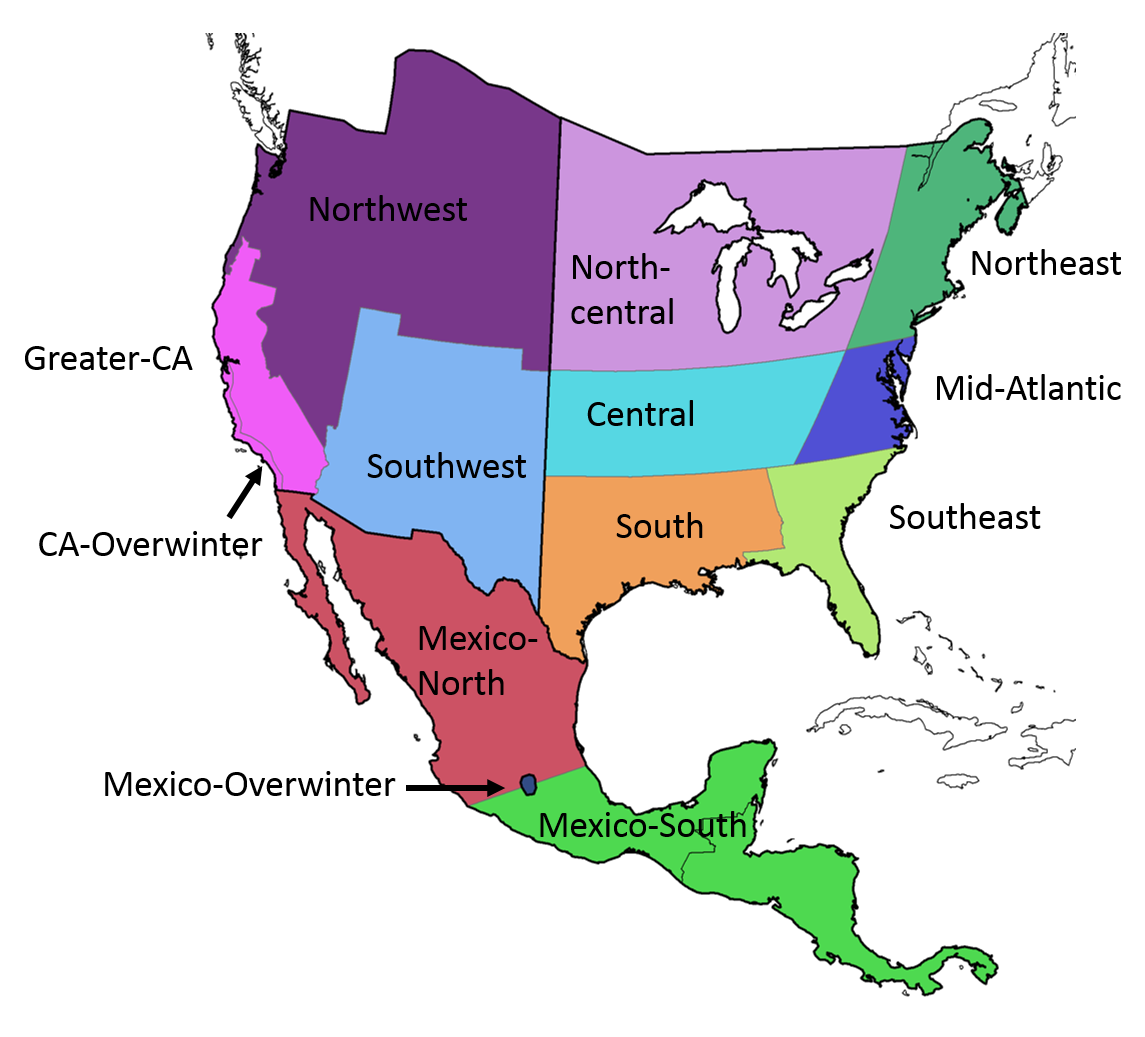
From this page, you have two ways of accessing monarch population trend information. One is our Regional Data Summaries of western and eastern populations during each of the four key migratory seasons (at right). Each link takes you to a separate page showing dynamics based on one or a few of our best monitoring data sets for each sub-region/season combination. Each page gives details on each program, how they measure monarch dynamics, how to interpret the graphs and how to get more information.
If you would like to see any set of regions or seasons, or different combinations of any of our partner programs that contribute data, please go to our our interactive data tool. This tool allows you to choose which data to visualize and make the comparisons that you want.

